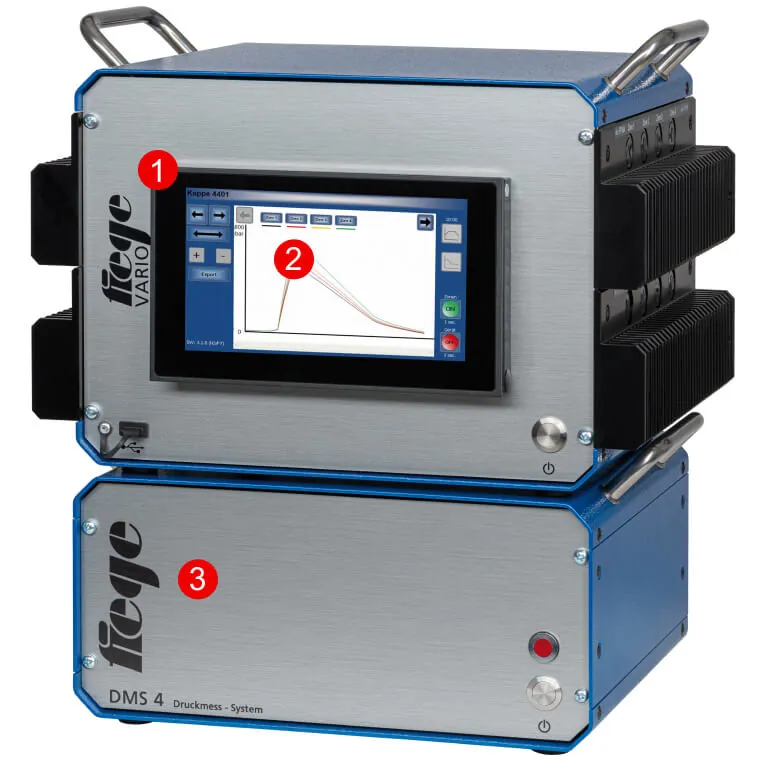
The pressure you see on the injection molding machine screen is not the pressure the part is actually subjected to. The difference may be more than a few bar — a significant part of the pressure is lost along the nozzle, runner, gate and flow resistance.
What determines the size, weight and internal structure of the part is the pressure inside the mold cavity. A process setting made without measuring this value is, to some extent, based on guesswork.
Why are machine pressure and cavity pressure different?
After the melt leaves the nozzle it passes through the runner channels and enters the cavity, narrowing at the gate. Every constriction and every distance produces pressure loss. With the same machine setting:
- If the gate is worn, more pressure reaches the cavity
- If the runner channel is contaminated, less reaches it
- When the melt viscosity changes with a batch difference, the loss changes too
- When the mold temperature falls, the flow resistance increases and the pressure drops
None of these is visible on the machine screen. While the machine shows that it "is applying the same pressure", the value in the cavity may have quietly changed — and the part weight is the first symptom noticed.
How is the pressure curve read?
The curve that appears when cavity pressure is plotted against time tells the story of the whole cycle:
| Region | What happens | What it shows |
|---|---|---|
| Rise | The melt enters the cavity, the pressure rises rapidly | Fill speed and flow resistance |
| Knee point | The cavity is full, the slope changes | Whether the switchover point is in the right place |
| Peak | Maximum pressure | Risk of flash and mold opening |
| Plateau | Holding pressure effective | Whether the holding pressure reaches the cavity |
| Decay | The gate freezes, the pressure dies away | The moment the effective holding time ends |
The area under the curve — the pressure integral — is related to the total energy delivered to the part and is strongly linked to part weight. That is why it gives an idea of quality within the cycle without weighing.
Methods for the fill study and determining the switchover point: Process diagnostic methods
What does the curve give away?
If the peak pressure is higher than expected: the mold can open at micron level and flash forms. For whether the clamping force is sufficient: tonnage calculator
If the peak pressure is low and the curve dies away early: not enough material is reaching the cavity — short shots and sink marks are to be expected.
If the knee point comes late: the switchover point is set too late; the pressure shoots up at the end of filling.
If the plateau stays short: the gate is freezing early; lengthening the holding time does not help, and the gate cross-section or temperature need to be looked at.
If the curve shifts from cycle to cycle: the process is unstable. The source is usually raw material moisture, dosing deviation or mold temperature fluctuation.
To see which way the parameters act: Parameter effects
Sensor placement — the decision that determines the result
The value of the measurement depends on where the sensor is placed:
If placed near the gate, it clearly shows the filling phase and the peak pressure; ideal for determining the switchover point.
If placed at the end of the flow path, it shows whether the cavity is completely filled; suitable for monitoring short shots.
In a multi-cavity mold, sensors are placed in more than one cavity; the difference in filling between cavities is seen directly. This puts an end to guessing which cavity fills late in an unbalanced mold.
Sensors can be placed directly (in contact with the cavity surface) or indirectly (measuring force from behind an ejector pin). Direct measurement is more precise; indirect measurement, on the other hand, leaves no mark on the mold surface and is easy to add to existing molds later.
Sensor diameter is also chosen according to the mold geometry — small-diameter sensors are needed in narrow areas and for thin-walled parts. The DMS system offers 2.5 · 4.0 and 5.0 mm sensor options.
Automatic good and bad part sorting
This is the most tangible benefit of cavity pressure measurement: for every cycle the pressure curve is compared with a defined acceptance band. When the curve goes outside the band, the part from that cycle is separated automatically.
What this means is that quality control is done within the cycle, not after it. There is no need to go back through the batch to find the suspect part.
It is an expected capability especially in the following areas:
- Medical — the requirement for part traceability and process validation
- Automotive safety parts — documentation of every part
- Technical parts — tight tolerances and customer audits
- Multi-cavity production — quality sorting per cavity
What does a measurement system require?
Cavity pressure is a quantity that changes very quickly; the system must be able to capture the milliseconds of the cycle. Technically, things to watch:
| Feature | Why it matters |
|---|---|
| Measuring range | Values of up to 2,000 bar can be seen in the cavity; the system must cover this range |
| Sensor sensitivity | Given in pC/bar — this shows that charge-based (piezoelectric) measurement is used |
| Resolution | The knee point and plateau transitions of the curve can only be distinguished at sufficient resolution |
| Channel count | A multi-cavity mold needs a sensor per cavity |
| Cycle synchronization | The measurement must be synchronized with the start of the cycle |
| Data transfer | A network connection for recording and reporting the curves |
The DMS system meets these requirements: a 0 – 2,000 bar range, 4 – 32 channels, 12-bit resolution and integration with the hot runner control unit over the network. In this way temperature and pressure data are monitored on the same interface: Hot runner control systems
Measurement does not fix anything — it shows
Pressure measurement on its own does not improve quality; it tells you where the problem is. If the curve is unstable, the solution lies not in the measurement system but at the source:
- Raw material moisture and dosing stability — plastic resin dryers and gravimetric dosing
- Stability of the mold temperature — mold temperature control units
- Mold condition — gate wear, contaminated channels: mold maintenance
- Zone deviations in the hot runner — control unit alarm records
Installing measurement and only monitoring the curve without fixing these sources goes no further than documenting the problem.
Who needs it, and for whom is it too early?
Needed: medical and automotive production with a process validation requirement · where cavity balance is critical in a multi-cavity mold · where the scrap rate has become costly in high-volume production · where the customer asks for data for every batch.
May be too early: in low-volume production with wide tolerances · if the mold and raw material side are not yet stable. In that case, first achieving stability in drying, dosing and mold temperature brings a higher return.
For sensor selection and system installation for your application, you can consult our technical support team.