One of the most frustrating complaints in the workshop is this: the part is on size as it comes out of the mold, checked with calipers, fine. Three weeks later it comes back from the assembly line — it no longer fits. Nobody has changed anything in the process, the machine is on the same settings, the mold is the same mold.
The answer is almost always in the same place: it has been overlooked that shrinkage is not a single number but two separate events.
Why shrinkage occurs
As the melt cools, the molecular chains move closer together and the volume of the material decreases. This is unavoidable; the problem is not that shrinkage exists but that it differs in different regions of the part.
In semi-crystalline materials (PP, POM, PA, PE) shrinkage is markedly higher than in amorphous ones (ABS, PC, PMMA, PS, SAN). The reason is crystallization: in crystalline regions the chains reach a much higher packing density, and therefore shrink more. Density and volume values by material are on our material processing values page.
Two separate events: mold shrinkage and post-shrinkage
Most arguments about dimensions reach a dead end because this distinction is not made.
| When it happens | What it affects | |
|---|---|---|
| Mold shrinkage | The first period after ejection from the mold; measured 16 hours later according to DIN 16901 | Mold dimensioning, first quality inspection |
| Post-shrinkage | Continues after 16 hours, over days and weeks | Assembly in the field, long-term tolerance |
| Total shrinkage | The sum of the two | The real final dimension of the part |
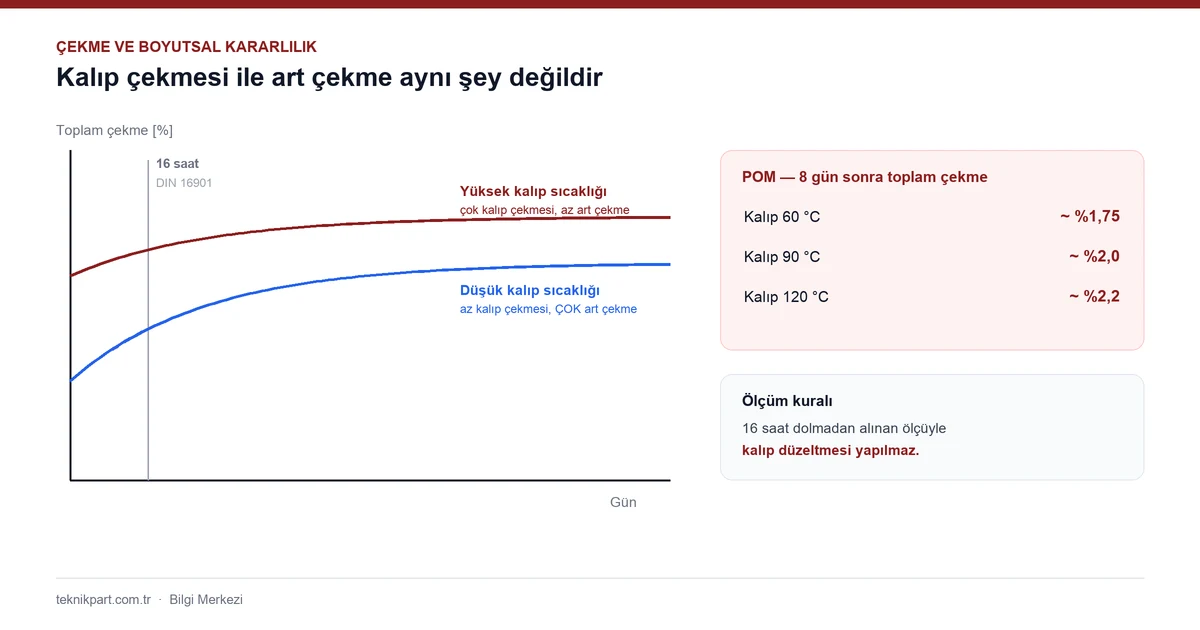
The first practical rule that follows is clear: no dimensional decision is made with a part fresh out of the mold. Grinding a mold is an irreversible and expensive operation; if it is based on a measurement taken before 16 hours have passed, the part is still shrinking and the correction is made on the wrong side.
Mold temperature: the biggest lever, but it has a reverse effect
The single parameter that affects shrinkage most is the mold wall temperature. The mechanism works like this:
At a low mold temperature the region near the wall cools very quickly. The molecules have no time to reach a high packing density; in semi-crystalline materials the formation of crystal structure is suppressed in the outer region and that layer remains almost amorphous. The result: low mold shrinkage, but high post-shrinkage.
At a high mold temperature cooling is slow and the chains reach a high packing density. The result: high mold shrinkage, but low post-shrinkage.
The critical point is this: if the ejection temperature is kept constant, total shrinkage is always greater at a high mold temperature. In other words, holding dimension by cooling the mold does not eliminate shrinkage — it only spreads it over time. What you gain in the mold, you lose in the field.
A POM example makes this concrete — the same part, with only the mold temperature changing:
| Mold wall temperature | Total shrinkage (after 8 days) |
|---|---|
| 60 °C | about 1.75% |
| 90 °C | about 2.0% |
| 120 °C | about 2.2% |
For products with tight tolerances that mate with other parts in assembly, the right strategy is not to lower the mold temperature: choosing the band the material requires and staying constant there makes post-shrinkage predictable.
The same mechanism has another side effect: in a semi-crystalline part the outer layer remains almost amorphous and the middle layer crystalline. In other words, two different shrinkage behaviors exist within a single part. In thick sections this difference grows.
Wall thickness and material
Wall thickness has a direct effect: a thick area cools slowly and shrinks more. If there are thick and thin sections in the same part, a difference in shrinkage arises; and differential shrinkage is the definition of warpage. In thick sections there is also a risk of sink marks and voids.
Glass fiber makes the matter direction-dependent. The shrinkage ratio between fiber and plastic is about 200:1; the fiber practically does not shrink and prevents the plastic from shrinking along its own direction. The result: a part that shrinks little in the flow direction and a lot perpendicular to it. That is why in fiber-filled materials the number and position of gates can be even more decisive than wall thickness.
Mineral fillers and glass beads create no directional dependence because of their geometry; that is why they are often used together with glass fiber to reduce the difference in shrinkage and warpage. For the differences between material groups, see our engineering plastics selection guide.
Which parameter changes shrinkage in which direction?
This table is the most useful summary at the machine:
| Parameter | Shrinkage when increased |
|---|---|
| Holding pressure | decreases |
| Holding time (up to the effective time) | decreases |
| Mold wall temperature | increases |
| Melt temperature | both ways |
| Injection speed | both ways |
The first three act in one direction and are predictable. The last two are confusing because they have two opposite effects: raising the temperature or the speed improves flow and therefore the transfer of holding pressure to the part (shrinkage decreases), but at the same time increases the shrinkage potential of the material (shrinkage increases).
The dominant effect is determined not by the absolute thickness of the part but by this ratio: the flow path length divided by the wall thickness.
- If the ratio comes out high (thin wall, long path), temperature and speed go up — the bottleneck is the pressure reaching the part.
- If the ratio comes out low (thick wall, short path), they go down — the pressure is already reaching it, and extra temperature only increases the shrinkage.
Saying "let's raise the temperature and it will be fixed" without making this distinction works on half of parts and backfires on the other half.
What can be done on the mold side
- Uniform wall thickness and symmetrical design; avoiding abrupt changes in cross-section and material accumulations
- Placing the gate at the thickest area — the wedge principle. In a part fed from the opposite direction, the thin section freezes first and holding pressure never reaches the thick area
- Choosing a sufficient gate diameter — a narrow gate freezes early and the transfer of holding pressure ends
- Providing uniform flow direction through the number and position of gates, moving weld lines to areas that carry no load
- Homogeneous mold wall temperature: separate temperature control circuits, good thermal separation of the part from the hot runner nozzle, thermally conductive mold material in areas that conventional temperature control cannot reach
Our mold cooling and channel design article gives a detailed framework for the layout of cooling channels and circuit planning.
What holds dimension is not the average but stability
This is the point most often missed on the shop floor. If a mold is to run at 45 °C, the point is not that the day's average is 45, but that it is 45 in every cycle. In a mold that warms up as the shift goes on, shrinkage drifts continuously; the measurement taken in the morning does not hold in the afternoon and nobody knows which part is the reference.
Three things determine this:
1. The capacity of the temperature control unit — an undersized unit cannot hold the target temperature as production heats up 2. Circuit separation — the two halves of the mold and its hot areas must be controlled separately; the part always bends toward the cold side 3. Whether the flow is really flowing — a circuit that appears connected but has scaled up makes measurements meaningless
For unit selection and the water/oil distinction see our what is mold temperature control article, and for the product side our temperature control systems page — the water and oil series are separated by temperature range.
Order of work for a part that does not hold dimension
1. Wait 16 hours. Do not take the measurement before this time; do not make mold corrections with a measurement taken earlier. 2. Measure the temperature of both mold halves. If there is a difference, close it first; this single step often gives the biggest improvement. 3. Verify the holding pressure and its effective time. The effective time is found by weighing; the method is in the mold commissioning procedure. 4. Look at the flow path ÷ wall thickness ratio and decide on that basis which way to take the melt temperature and speed. 5. Check the direction in fiber-filled material. If the deviation is pronounced perpendicular to the flow direction, the problem is not the parameters but the gate position. 6. Decide with parts produced in the same cycle. Grinding the mold with a measurement taken from a different cycle turns the correction into a permanent error. 7. Record the process. If cavity pressure is measured, the reference curve is the most reliable document; the method is in our cavity pressure measurement article.
For defect-based diagnosis of dimensional deviations you can use the dimensional and weight deviations page, and for the shrinkage–cycle relationship the how to shorten cycle time article. To size your mold's temperature control requirement correctly, you can write to our technical support team.